How to find real support and resistance
Dec 06, 2025 1:40 pm
Dear ,
Today is Day 7, and we’re going back to something fundamental.
but very misunderstood:
Support and Resistance.
Most traders draw 10–12 lines on their chart,
get confused,
and then blame the market.
But the truth is,
you only need 2 zones most of the time.
Not lines.
Not levels.
Zones.
Let me explain this
The problem most traders have:
They draw support/resistance like this:
- a straight horizontal line
- anywhere it “looks correct”
- based on guesses
- based on one candle
This doesn’t work.
Markets don’t respect lines.
They respect areas.
So here is the simple rule:
“Mark zones, not lines.”
A zone is basically:
The area where buyers or sellers stepped in strongly.
Not one point.
Not one price.
But a small region.
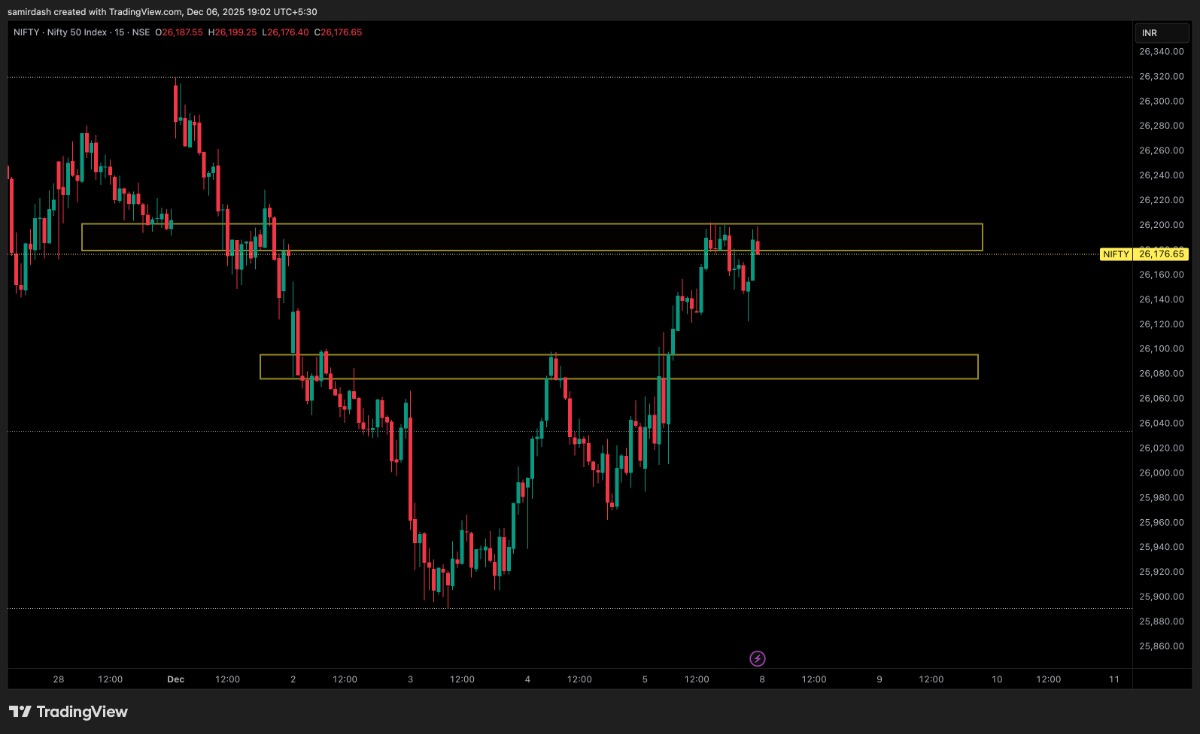
(Nifty Chart for Reference Only)
How to find REAL support zones
Look for an area where:
- Price fell
- Price suddenly stopped
- Then price bounced strongly
This “bounce area” is your real support zone.
Mark it as a box,
from the wick to the body.
That’s it.
How to find REAL resistance zones
Look for an area where:
- Price went up
- Price stalled
- Then reversed strongly
This “stall + drop” area is your resistance zone.
Again, mark it as a small box.
Why does this work better than lines
Because buyers and sellers don’t place orders at one exact price.
They place them in a range.
That’s why price:
- wicks inside the zone
- hunts liquidity inside the zone
- and then moves away
Lines get broken easily.
Zones hold well.
How to use these zones for entries
For buys:
Wait for the price to come into your support zone.
look for rejection,
Enter in the confirmation candle.
For sells:
Wait for the price to revisit the resistance zone.
Look for rejection,
Enter on confirmation.
Simple and clean trading.
Mistakes to avoid
- Drawing too many zones
- Marking zones in the middle of nowhere
- Entering without confirmation
- Expecting zones to work 100% of the time
A good zone simply gives you a better probability.
That’s all trading is — Probability + Discipline.
Practice Time
Open your chart.
Mark only:
- 1 support zone
- 1 resistance zone
Just two.
And see how the price reacts around them.
You’ll instantly feel how clean your chart becomes.
Tomorrow (Day 8),
We’ll talk about something extremely useful:
How to avoid choppy markets and sideways traps.
This will save you from unnecessary trades.
With Love & Respect,
Samir