Secular State Legislators by the Numbers (Part 2)
Feb 27, 2025 5:13 pm
Two weeks ago, we looked at openly secular representation in state legislatures. Only over half of all states have at least one secular legislator, and 21 states have no openly secular legislators. In this post, I will analyze the data by Census Regions and Divisions.* The data sheds light on the relationship between the regional and divisional distribution of the nonreligious and their political representation in state legislatures.
The figure below shows that the Northeast and Midwest regions have the highest proportion of nonreligious adults, at 26%. Twenty-three percent of residents in the West are nonreligious, while the South has the lowest proportion of nonreligious adults at 21%. However, there are differences in where people live.
The South may have the lowest proportion of nonreligious adults, but a plurality of nonreligious people (32%) live in the South, while a slightly lower share lives in the West (29%). By contrast, while being more secular on aggregate, the Northeast (18%) and Midwest (21%) are not where nonreligious adults tend to live. Just 39% of nonreligious adults live in these regions combined.
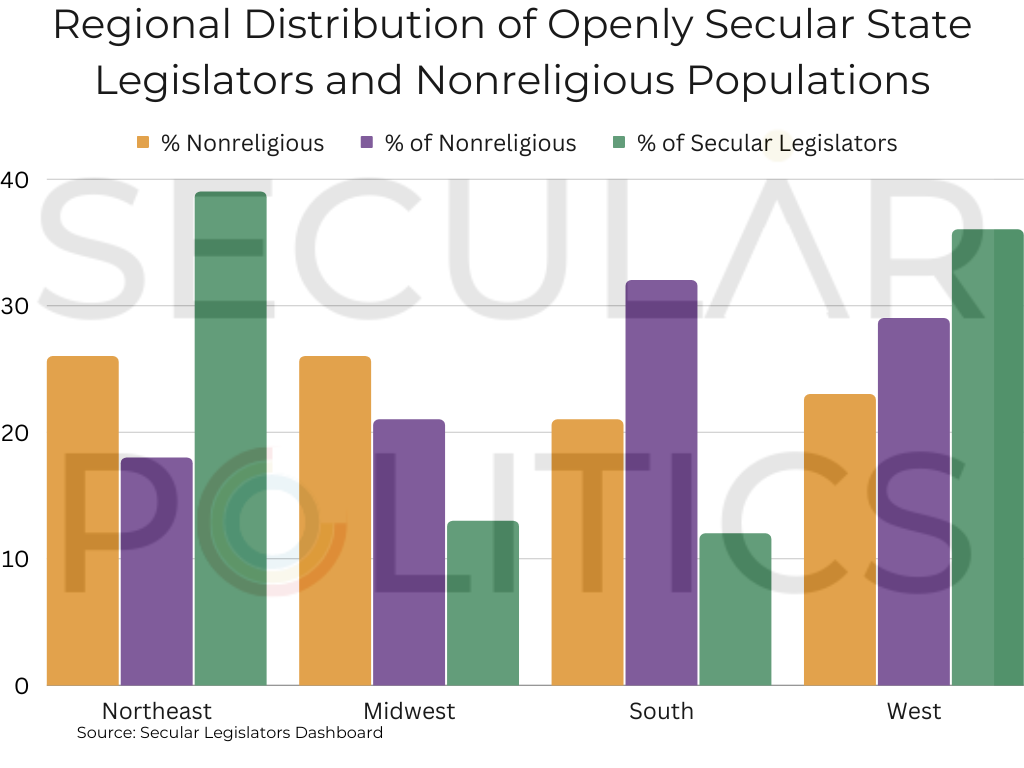
The data also shows that the Northeast and the West have the highest percentage of openly secular legislators, at 39% and 36%, respectively. The Midwest and South have much lower percentages, at 13% and 12%, respectively. To sum up, three-quarters of openly secular state legislators come from regions that have 47% of the nonreligious population. Furthermore, a plurality of those legislators is from the region with the nonreligious are less likely to live.
There’s a significant reason why neither the proportion of nonreligious in a region nor the distribution of the nonreligious population by region relate to the distribution of openly secular legislators. But we can see that image more closely if we look at the divisional distribution.
New England (31%), Pacific (31%), and Mountain (29%) divisions have the highest share of nonreligious adults living within their borders. However, the majority (58%) of openly secular state legislators come from two divisions. New England (32%) accounts for nearly one-third of all openly secular legislators, while over one-quarter (26%) belong to legislatures in the Mountain division. These two divisions account for just 15% of the nonreligious population in the United States.
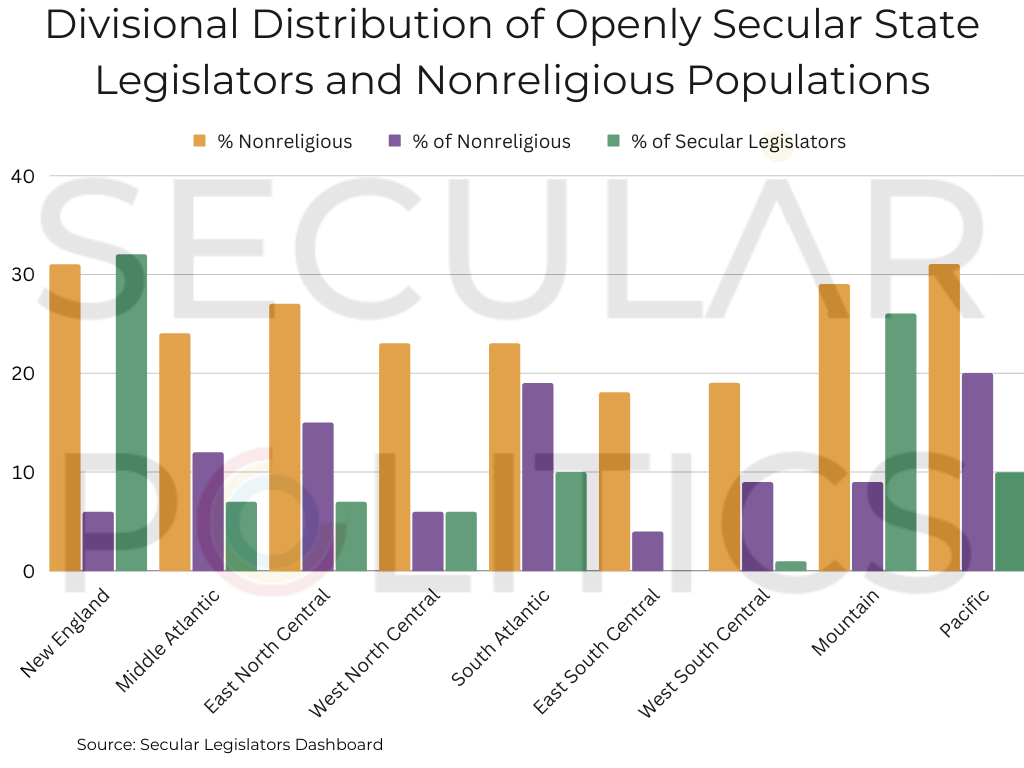
Two divisions, the South Atlantic (20%) and the Pacific (19%), are home to nearly four in ten nonreligious adults. But just 20% of secular legislators come from these divisions.
We shouldn’t be surprised that New England has several openly secular legislators, but why one-third of all openly secular legislators? The answer is opportunity. The five New England states with at least one secular legislator have 1,177 total seats combined, an average of 235 seats per legislature. New Hampshire alone has 424 seats. Thus, New England not only has a large proportion of nonreligious adults, but openly secular candidates in New England have more opportunities to represent their districts. In a world with 69 openly secular state legislators coming from the states currently represented, we should expect 19 of those from New England based on the number of seats. There are 22 openly secular New England state legislators. However, New England is not the most overrepresented division.
The Mountain Division is home to 18 (26%) openly secular state legislators. Based on the number of seats those states have (724), we should expect 11 (17%) legislators to come from this division.
The most underrepresented of these divisions is the Middle Atlantic. We should expect nine legislators from these states (13%), but they have a combined five legislators (7%).
This exercise has helped me to think about the representation of nonreligious Americans. Because it is not just a matter of people running but also of having the opportunity. New England and Mountain states provide more opportunities, and it shows in their overrepresentation. But there are other factors we haven’t taken into account. For example, how gerrymandering may affect the people getting elected to office or barriers to entry such as entrance fees or the cost of running for office.
Other news:
- Hemant reports an openly secular local elected official is resigning. Her ordeal shows how the challenges to being an openly secular elected official go beyond the institutional factors (such as the number of seats and fundraising acumen) but also how the culture around us promotes religious voices over secular ones.
- The Secular Coalition for America announced their 2023 Lobby Day dates (March 23-24). Register here.
*The United States Census Divisions are located in four Census Regions: Northeast, South, Midwest, and West. The following Census Divisions are located in each region:
- Northeast Region:
- New England Division (Connecticut, Maine, Massachusetts, New Hampshire, Rhode Island, and Vermont)
- Middle Atlantic Division (New Jersey, New York, and Pennsylvania)
- South Region:
- South Atlantic Division (Delaware, Florida, Georgia, Maryland, North Carolina, South Carolina, Virginia, and West Virginia)
- East South Central Division (Alabama, Kentucky, Mississippi, and Tennessee)
- West South Central Division (Arkansas, Louisiana, Oklahoma, and Texas)
- Midwest Region:
- East North Central Division (Illinois, Indiana, Michigan, Ohio, and Wisconsin)
- West North Central Division (Iowa, Kansas, Minnesota, Missouri, Nebraska, North Dakota, and South Dakota)
- West Region:
- Mountain Division (Arizona, Colorado, Idaho, Montana, Nevada, New Mexico, Utah, and Wyoming)
- Pacific Division (Alaska, California, Hawaii, Oregon, and Washington)

