
View Online | Subscribe | Partner With Us

Add Data Explained to Google | Download Our H1 2026 Report on AI
FEATURE STORY
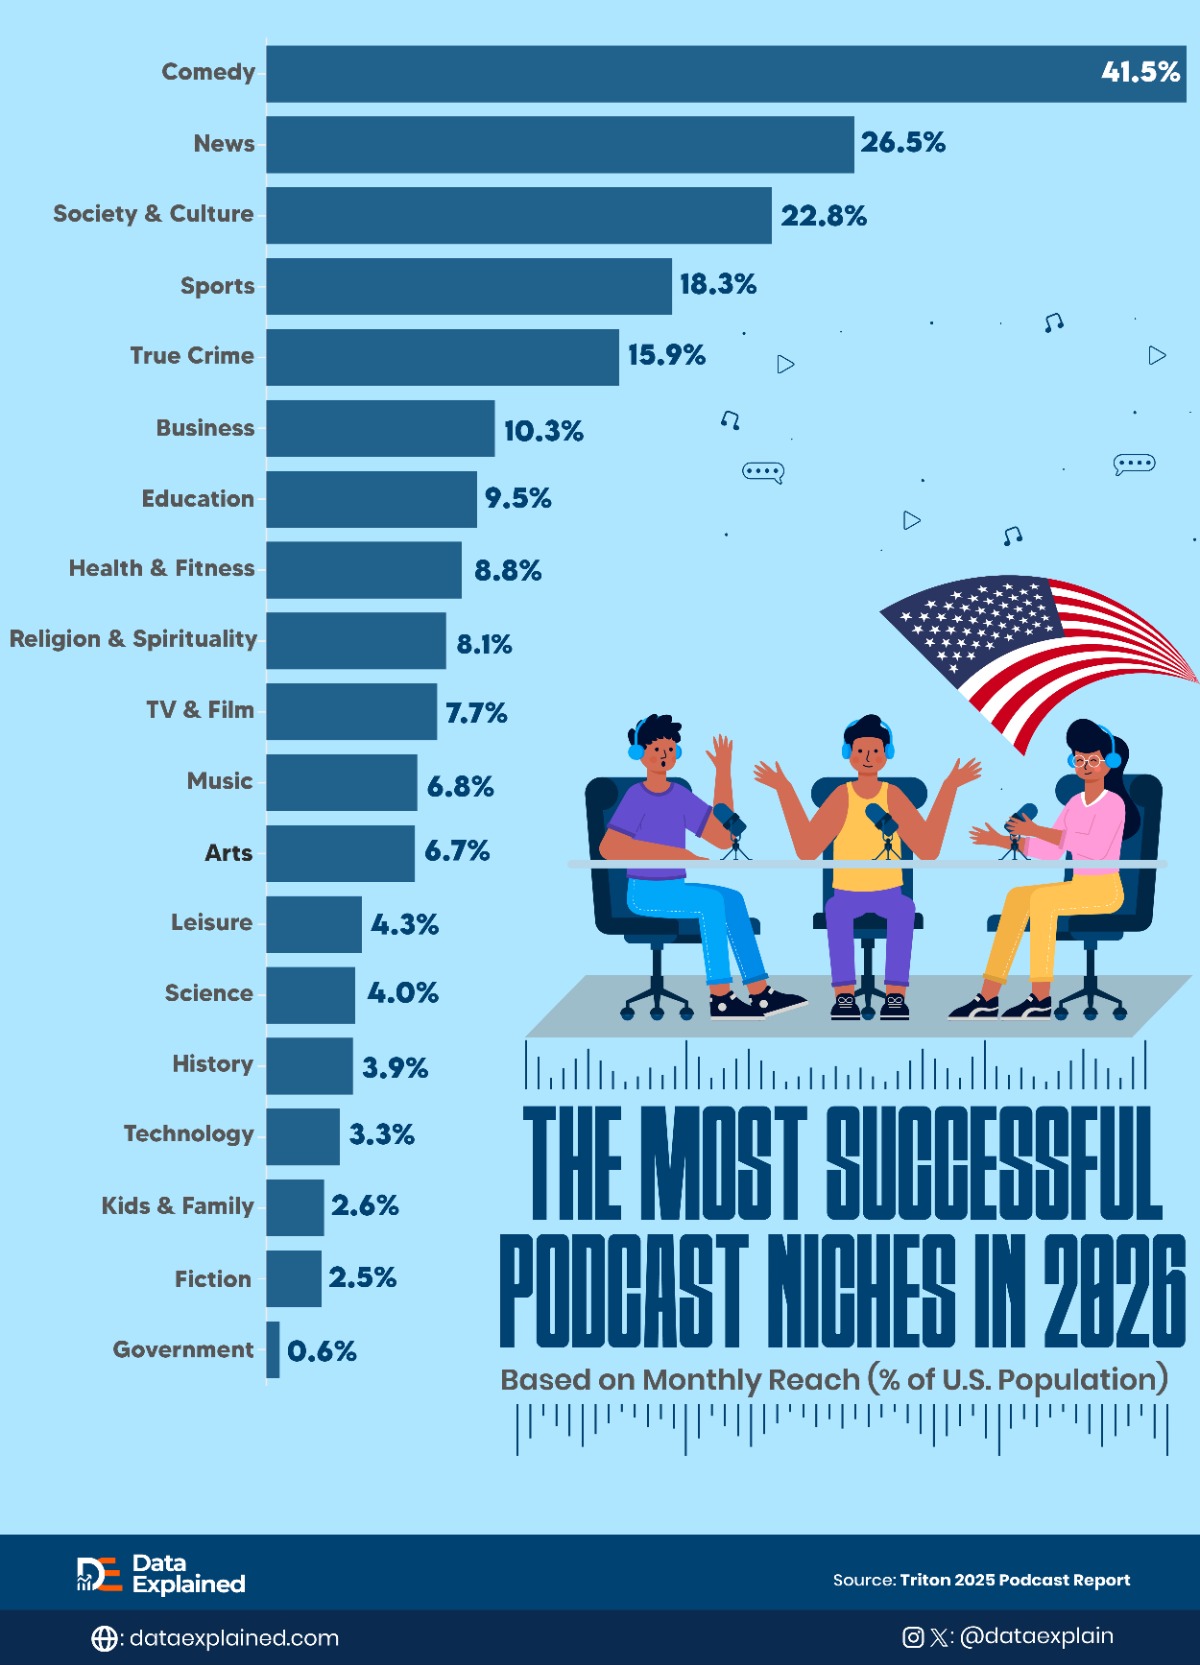
Comedy podcasts reach 41.5% of Americans every month. That means more than four in ten Americans listen to a comedy podcast in any given month. News ranks second, while True Crime, the genre most associated with podcasting's cultural breakthrough, sits fifth at 15.9% monthly reach.
You Might Also Like...

Charted: All of Microsoft's Acquisitions in 20 Years
Microsoft made more than 150 acquisitions between 2006 and 2026, with 2024 the only full year it completed zero deals.
Ireland Has The Most Degree-Holding Population In The World
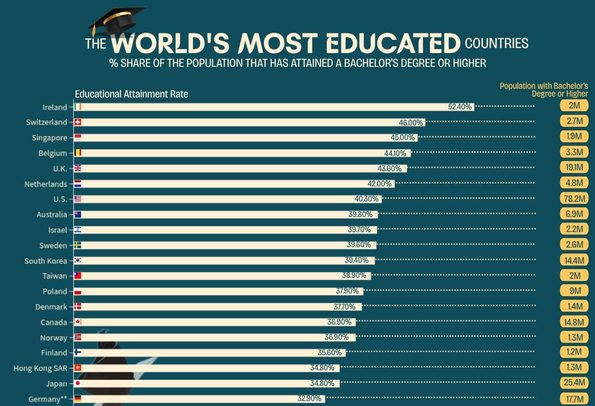
Ireland leads all countries with 52.4% of working-age adults holding a bachelor's degree, ahead of Switzerland at 46% and Singapore at 45%.

Three Pizza Chains Control 70% of the Top-10 U.S. Market
Domino's, Pizza Hut, and Little Caesars together operate 17,664 U.S. locations out of the 25,260 tracked in the top-10 market.

Who Is Building The Most Skyscrapers Around The World?
China has 3,568 skyscrapers (nearly four times America's 934), and the UAE ranks fourth by total count but first in buildings above 300 meters.
Got a question or a data story you think we should cover? Just reply to this email. It comes straight to me, and I read every single one.
Talk soon,
Emmanuel,
Editor-in-Chief, Data Explained.
Did someone forward this email to you? Subscribe here.

Data Explained is making global data useful for everyone
Help us spread the word by sharing this newsletter with family, friends, and colleagues.
Copyright (C) 2026 Data Explained. All rights reserved.
0 comments