Strategic Thinking Exercise Series - Week 7
Aug 04, 2025 6:56 pm
This is part 7 of our 9-part tabletop exercise series. Please read from part 1 chronologically and enjoy each week as we spotlight three exercises from our new PRISM Strategic Tabletop Exercise Guide Deck—27 decision-making tools that teams can run in real-time, in real rooms, on real challenges.
Systems Systems Systems
This week introduces three systematic systems exercises in sequence—Causal Loop Diagrams → Constraint Maps → Wardley Maps—that transform validated strategies into systems-integrated approaches by mapping cause-effect relationships, identifying leverage constraints, and understanding competitive positioning within evolving strategic landscapes.
Why this specific progression: Causal relationships first (understand system dynamics and feedback loops), constraint analysis second (identify leverage points and bottlenecks), strategic positioning third (map competitive evolution and value chain dynamics). Each exercise reveals different aspects of systems complexity that linear thinking misses.
The meta: Problems exist in systems; solutions must account for system dynamics. Individual element optimisation without systems integration creates expensive success that becomes systemic failure. Strategic advantage emerges from understanding and leveraging system relationships rather than just optimising component performance.
🎲 Causal Loop Diagrams – Feedback lens
What: Visual systems methodology that maps cause-and-effect relationships between key variables, identifies reinforcing and balancing feedback loops, and reveals system dynamics that determine long-term strategic outcomes beyond immediate linear effects.
Why: Linear thinking assumes direct cause-effect relationships without feedback or delay. Systems thinking recognises that strategic actions create responses that influence original causes, creating feedback loops that amplify or counteract intended effects. Understanding these dynamics prevents unintended consequences and enables leverage point identification.
When: Following assumption validation when strategic integration needs systems perspective, during strategic planning, before major organisational changes, any situation where actions could trigger systemic responses affecting long-term competitive advantage.
The Steps
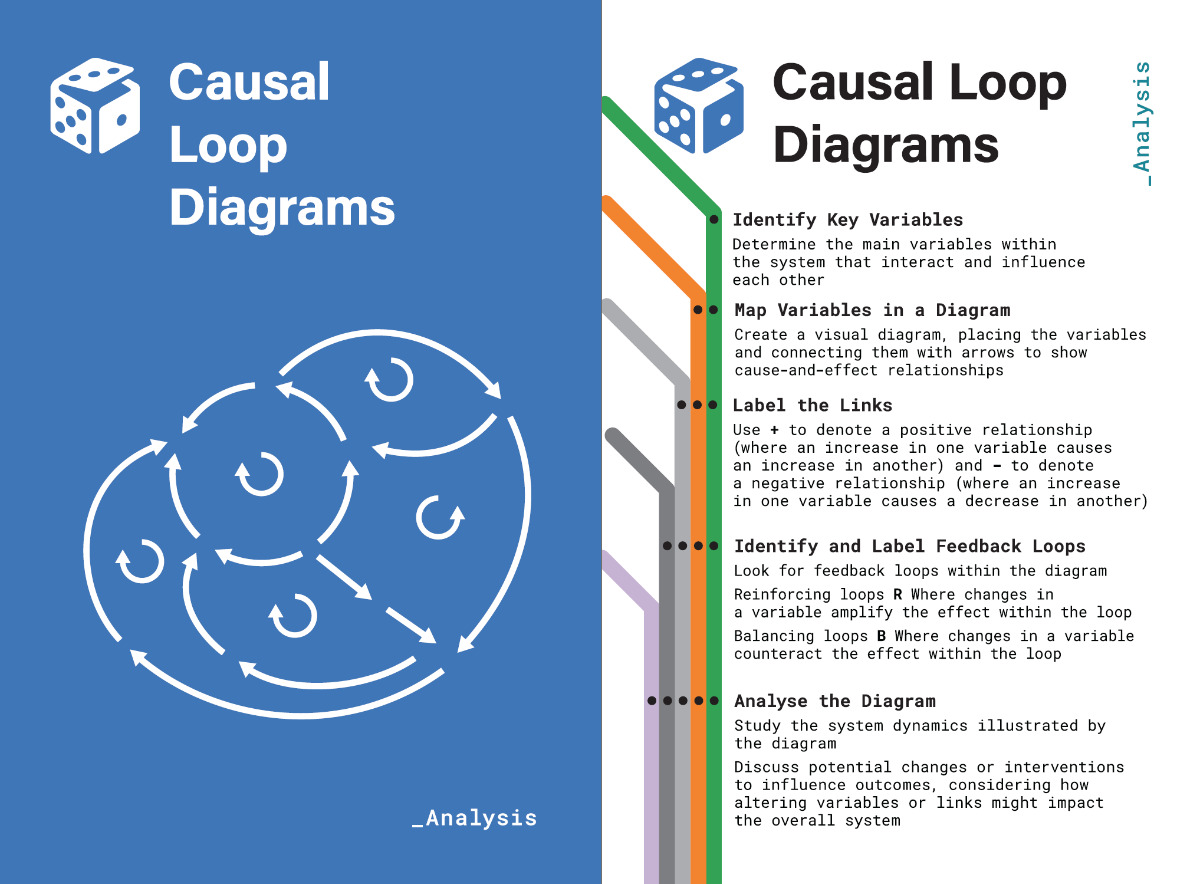
Step 1: Identify Key Variables Determine the main variables within your strategic system that interact and influence each other. Include internal variables (capabilities, processes, resources) and external variables (customer behaviour, competitive responses, market conditions). Focus on variables that change over time and affect strategic outcomes.
Step 2: Map Variable Relationships Create a visual diagram placing variables and connecting them with arrows showing cause-and-effect relationships. Use consistent arrow notation: solid arrows for direct causation, dashed arrows for influence or correlation. Direction shows causation flow from the influencing variable to the influenced variable.
Step 3: Label Relationship Polarity Mark each causal link with polarity indicators: positive (+) where an increase in the cause variable leads to an increase in the effect variable, negative (-) where an increase in the cause variable leads to a decrease in the effect variable. Polarity determines whether changes amplify or counteract through the system.
Step 4: Identify and Label Feedback Loops Trace circular pathways where variables influence each other in closed loops. Identify reinforcing loops (R) where changes amplify through the system, and balancing loops (B) where changes get counteracted or stabilised. Count positive and negative links to determine loop type.
Step 5: Analyse System Dynamics for Strategic Intervention Study system behaviour patterns revealed by loop structure. Identify leverage points where small changes could produce large systemic effects. Develop intervention strategies that work with system dynamics rather than against them, considering time delays and unintended consequences.
Facilitation
Variable selection discipline: Choose variables that are measurable, changeable, and strategically relevant. Avoid abstract concepts ("culture") in favour of observable behaviours ("employee retention rate," "decision-making speed"). Include both leading and lagging indicators to capture system dynamics.
Relationship validation: Test causal relationships by asking "If X increases, does Y consistently increase or decrease?" Distinguish between correlation and causation. Include only relationships where the causal mechanism can be explained, not just statistical correlation.
Loop identification technique: Start from any variable and follow causal arrows in a complete circle back to the starting variable. Count positive and negative links: an even number of negative links creates a reinforcing loop, an odd number creates a balancing loop. Complex systems typically contain multiple interacting loops.
Delay recognition: Identify time delays between cause and effect in causal relationships. Mark delays on the diagram with double lines (||) on arrows. Delays often create system instability and counterintuitive behaviour where effects appear long after causes.
Example Applications
Digital transformation causal loop analysis:
Key variables identified:
- Digital tool adoption rate
- Employee productivity
- Process automation level
- Customer satisfaction
- Competitive advantage
- Investment requirements
- Organisational resistance
- Change management capability
Causal relationships mapped:
- Digital tool adoption (+) → Employee productivity (+) → Customer satisfaction (+) → Competitive advantage
- Competitive advantage (+) → Investment requirements (+) → Digital tool adoption
- Digital tool adoption (+) → Organisational resistance (-) → Change management capability (-) → Digital tool adoption
- Process automation (+) → Employee resistance (+) → Organisational resistance
- Investment requirements (+) → Management pressure (+) → Change pace (+) → Organisational resistance
Feedback loops identified:
- Reinforcing Loop R1: Digital adoption → Productivity → Customer satisfaction → Competitive advantage → Investment → Digital adoption (virtuous growth cycle)
- Balancing Loop B1: Digital adoption → Organisational resistance → Reduced change capability → Slower digital adoption (resistance limiting loop)
- Reinforcing Loop R2: Investment pressure → Faster change → Higher resistance → Lower capability → Slower adoption → More pressure (vicious cycle)
System dynamics insights: Success depends on managing the resistance-limiting loop while accelerating positive growth loop. Rapid investment without change management creates a resistance spiral. Optimal strategy: moderate investment pace with strong change management to prevent resistance buildup while building positive momentum.
Strategic interventions: Focus on change management capability as a leverage point that enables positive loops while preventing negative spirals. Sequence digital adoption to build early wins reinforcing competitive advantage before resistance accumulates.
Pattern Recognition
Reinforcing loops: Create exponential growth (virtuous cycles) or decline (vicious cycles). Success builds on success, or failure accelerates failure. Identify positive reinforcing loops to amplify and negative reinforcing loops to interrupt.
Balancing loops: Create stability and resistance to change. Natural system governors that prevent unlimited growth or decline. Understanding balancing loops prevents frustration when growth hits natural limits.
Loop dominance: In complex systems with multiple loops, one loop typically dominates system behaviour at any time. System behaviour changes when dominance shifts between loops. Identify conditions that cause dominance shifts.
Delays and oscillations: Time delays between causes and effects create system instability and oscillating behaviour. People continue pushing when effects haven't appeared yet, then over-correct when delayed effects finally manifest.
Integration and Maintenance
Leverage point hierarchy: Meadows' leverage hierarchy ranks intervention effectiveness:
- Paradigms (worldviews that create systems)
- Goals (purpose of system)
- Power structure (who decides)
- Rules (incentives, constraints)
- Information flows (who gets what data when)
- Material elements (subsidies, taxes)
Unintended consequence anticipation: Use causal loops to predict how strategic interventions might trigger unintended responses. Every action creates reactions through system relationships. Design interventions considering full system response.
Timing and sequencing: System interventions often require specific timing and sequencing to be effective. Some changes must precede others to avoid triggering limiting loops. Map intervention sequences that work with system dynamics.
🎲 Constraint Maps – Bottleneck Spotlight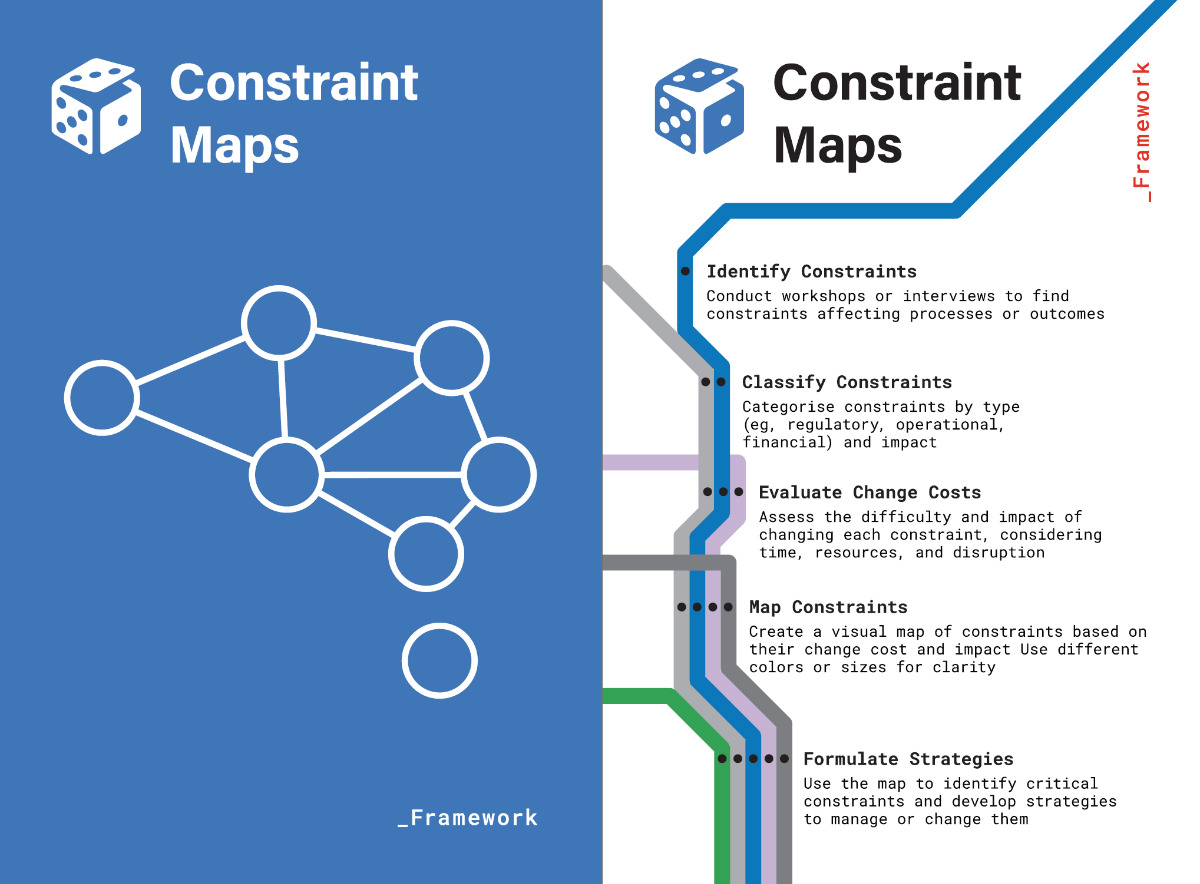
What: Visual constraint identification and analysis methodology that maps limitations affecting strategic performance, categorises constraints by type and impact, and identifies leverage points where constraint modification creates disproportionate strategic improvement.
Why: Theory of Constraints demonstrates that system performance is limited by its weakest elements. Traditional improvement efforts spread resources across multiple areas while constraint theory focuses improvement on bottlenecks that actually limit system performance. Constraint mapping reveals where strategic focus creates maximum leverage.
When to deploy: Following causal loop analysis to identify system bottlenecks, during performance improvement planning, resource allocation decisions, any situation requiring maximum strategic leverage from limited improvement resources.
The Steps
Phase 1: Conduct Systematic Constraint Discovery Use workshops, interviews, data analysis, and process observation to identify all constraints affecting strategic performance. Include resource constraints (budget, talent, time), process constraints (capacity, capability, complexity), market constraints (demand, regulation, competition), and organisational constraints (culture, structure, systems).
Phase 2: Classify Constraints by Type and Impact Categorise identified constraints using multiple classification dimensions: constraint type (resource, process, market, organisational), change difficulty (easy, moderate, hard, nearly impossible), performance impact (low, medium, high, critical), and time horizon (immediate, short-term, medium-term, long-term).
Phase 3: Evaluate Constraint Modification Costs Assess difficulty and resource requirements for changing each constraint. Consider direct costs (budget, time, effort), indirect costs (disruption, risk, opportunity cost), and implementation complexity (technical, organisational, political). Some constraints may be unchangeable within realistic planning horizons.
Phase 4: Create Visual Constraint Map Develop visual representation plotting constraints by change cost (X-axis) and performance impact (Y-axis). Use colour coding or symbols to distinguish constraint types. This reveals high-impact, low-cost constraint modifications that provide maximum strategic leverage while highlighting constraints that may not warrant modification efforts.
Facilitation
Constraint discovery completeness: Use systematic questioning across all strategic domains. "What prevents us from achieving 2x current performance?" "What would have to change for us to serve 10x more customers?" "What stops us from reducing costs by 50%?" Push beyond obvious resource constraints to discover hidden systemic limitations.
Impact calibration: Distinguish between constraints that limit current performance and constraints that prevent future growth. Current performance constraints need immediate attention while growth constraints require long-term strategic focus. Some constraints may not actually limit system performance despite appearing important.
Change cost realism: Assess constraint modification difficulty realistically rather than optimistically. Include organisational change requirements, political resistance, technical complexity, and resource competition. Many apparent constraints prove unchangeable within reasonable strategic timeframes.
Leverage identification: Focus on constraints where small changes produce large performance improvements. High-leverage constraints often involve information flows, decision rights, or process sequences rather than resource additions. Look for constraint modifications that affect multiple performance dimensions simultaneously.
Example Application
SaaS platform scaling constraint analysis:
Constraint discovery results:
- Technical: Database query performance, API rate limits, server capacity, integration architecture
- Process: Customer onboarding complexity, support ticket resolution time, feature development cycle
- Resource: Engineering talent availability, customer success capacity, marketing budget
- Market: Customer acquisition cost, competitive feature parity, regulatory compliance requirements
- Organisational: Decision-making speed, cross-team coordination, quality assurance processes
Constraint classification matrix:
- High impact, low change cost: API optimisation, onboarding automation, support process standardisation
- High impact, high change cost: Database architecture redesign, talent acquisition, competitive differentiation
- Low impact, low change cost: Minor UI improvements, internal tool optimisation, reporting enhancements
- Low impact, high change cost: Office space expansion, enterprise sales team, comprehensive rebranding
Visual constraint map insights: Database performance emerges as critical bottleneck limiting customer growth and satisfaction. API optimisation provides quick wins while database redesign requires major investment. Customer onboarding complexity constrains expansion velocity with moderate modification difficulty.
Strategic leverage priorities:
- Immediate: API optimisation and support process standardisation (high impact, low cost)
- Short-term: Database architecture redesign (critical impact, manageable cost with planning)
- Long-term: Engineering talent acquisition (high impact, sustained effort required)
Constraint modification strategy: Parallel approach addressing immediate performance constraints while planning major architectural improvements. Avoid resource constraints until system constraints are optimised.
Pattern Recognition
Bottleneck identification: True constraint is the one factor that, if improved, increases overall system performance. Non-constraints may be inefficient but don't limit system output. Focus improvement efforts only on true constraints until they no longer limit factors.
Constraint migration: When one constraint gets resolved, another becomes the system limiter. Successful constraint management requires anticipating constraint migration and preparing next-level improvements rather than assuming single constraint resolution creates unlimited performance.
Local vs. global optimisation: Improving non-constraint performance may actually reduce system performance by creating imbalances. Optimise constraint performance even if it requires reducing efficiency in non-constraint areas.
Investment prioritisation: Investment in constraint improvement provides positive ROI while investment in non-constraint improvement often provides negative ROI. Use constraint analysis to guide resource allocation decisions and avoid waste on non-limiting improvements.
Integration and Maintenance
Constraint roadmap development: Create a timeline showing constraint resolution sequence and expected performance improvements. Some constraints must be resolved before others become visible or addressable.
Resource allocation discipline: Allocate improvement resources only to current constraints rather than distributing efforts across all performance areas. This concentrates leverage and accelerates overall performance improvement.
Performance measurement alignment: Measure and reward constraint performance rather than non-constraint efficiency metrics. Misaligned measurement systems often optimise non-constraints while ignoring true limiting factors.
🎲 Wardley Maps – Strategic Altitude
What: Strategic landscape visualisation methodology maps business components by user visibility and evolutionary maturity, revealing competitive positioning opportunities and strategic movement patterns within evolving value chains.
Why: Traditional strategic analysis treats all business elements as static entities without recognising evolutionary patterns determining competitive advantage over time. Wardley mapping reveals how strategic components evolve from innovation to commodity, enabling positioning strategies that leverage evolutionary forces rather than fighting them.
When to deploy: Following constraint analysis to understand competitive positioning context, during strategic planning, technology investment decisions, and any situation requiring understanding of competitive evolution and value chain dynamics within changing strategic landscapes.
The Steps
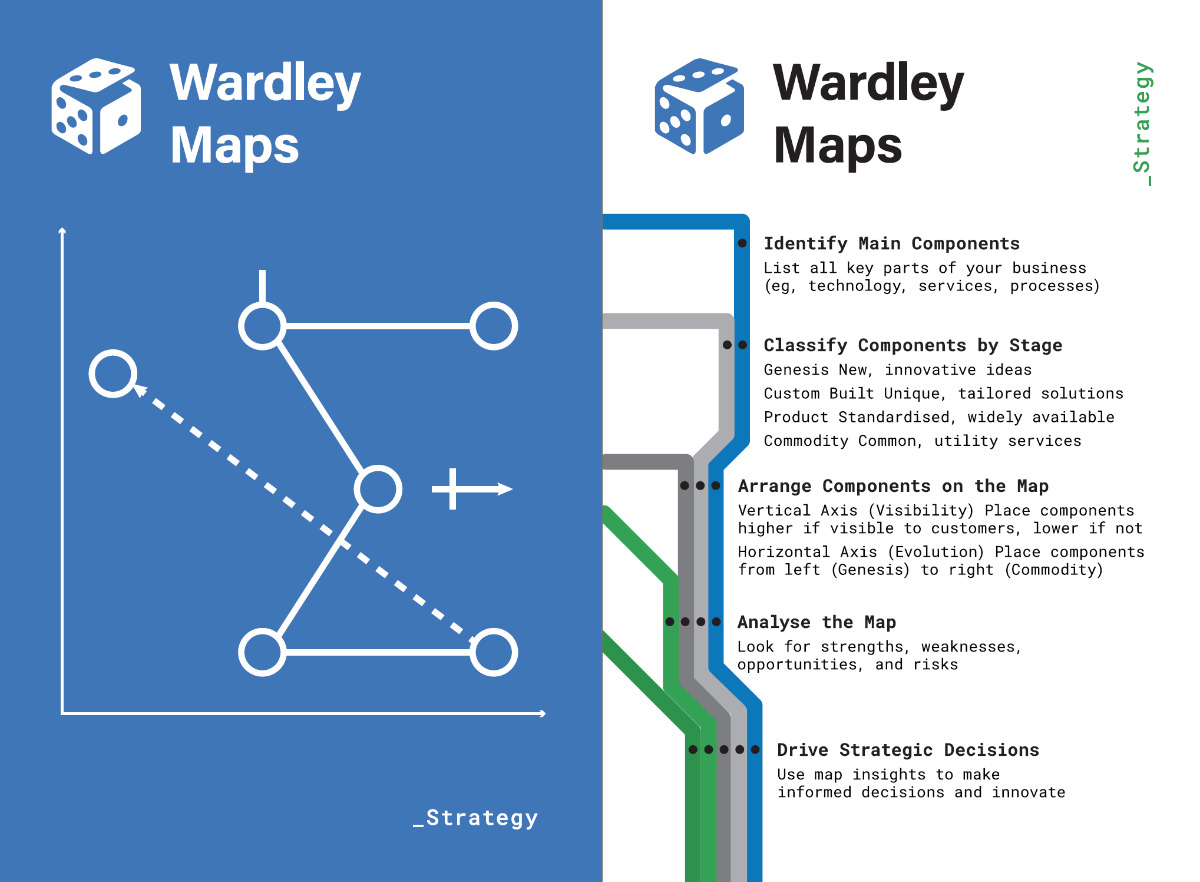
Stage 1: Identify Main Business Components List all key elements of your business value chain, including technology components, services, processes, capabilities, and customer-facing elements. Include internal components (what you control) and external components (what customers, partners, or suppliers provide). Focus on components that affect competitive advantage.
Stage 2: Classify Components by Evolutionary Stage Assess each component's evolutionary maturity using the four-stage model:
- Genesis: New, innovative, uncertain, requires experimentation
- Custom-built: Unique, tailored solutions, competitive differentiation
- Product: Standardised, widely available, best practice implementation
- Commodity: Common, utility services, cost optimisation focus
Stage 3: Position Components on Strategic Map Create two-dimensional map with vertical axis representing user visibility (high visibility at top for user-facing components, low visibility at bottom for infrastructure) and horizontal axis representing evolutionary stage (Genesis on left, Commodity on right). Position each component based on visibility and maturity.
Stage 4: Analyse Strategic Patterns and Movement Examine component positioning patterns, identify evolutionary pressures moving components rightward, spot strategic opportunities in positioning mismatches, and develop strategies that leverage evolutionary forces rather than resisting natural component evolution toward commodity.
Facilitation
Component granularity: Choose appropriate detail level for strategic decision-making. Too granular creates overwhelming complexity while too abstract misses strategic insights. Focus on components that could affect competitive advantage or strategic positioning decisions.
Evolution assessment objectivity: Evaluate component maturity based on market characteristics rather than organisational preferences. Components become commodities regardless of organisational desires when market forces create standardisation and widespread availability.
Visibility calibration: Assess visibility from user perspective rather thanthe organisational perspective. Components may seem important internally but have low user visibility, or vice versa. User visibility determines component strategic positioning potential.
Movement prediction: Identify forces pushing components toward greater maturity and standardisation. Technology improvement, market competition, and customer expectations consistently drive evolution toward commodity regardless of individual organisation strategies.
Example Application
FinTech platform strategic mapping:
Component identification:
- User-facing: Mobile app interface, customer onboarding, transaction processing, customer support
- Business logic: Risk assessment algorithms, compliance systems, data analytics, reporting dashboards
- Infrastructure: Payment processing, database systems, security frameworks, cloud hosting
- External: Regulatory compliance, banking partnerships, third-party integrations, market data
Evolutionary classification:
- Genesis: Risk assessment algorithms (proprietary innovation), advanced analytics (competitive differentiation)
- Custom-built: Mobile app interface (unique design), customer onboarding (tailored experience)
- Product: Compliance systems (standardised implementation), reporting dashboards (best practice)
- Commodity: Database systems (utility service), cloud hosting (infrastructure commodity)
Strategic map positioning: High user visibility components include mobile interface and onboarding experience. Low visibility infrastructure includes databases and hosting. Genesis-stage algorithms provide competitive advantage while commodity infrastructure enables cost optimisation.
Strategic insights and movements:
- Risk algorithms under pressure to standardise as regulatory requirements create common approaches
- Mobile interface differentiates but trending toward design standardisation
- Compliance systems commoditising rapidly due to regulatory clarity
- Cloud infrastructure already commoditised, focus on cost optimisation
Strategic positioning strategy: Maintain Genesis-stage competitive advantage in risk assessment while allowing commoditisation of infrastructure for cost benefits. Invest in next-generation analytics to stay ahead of algorithm commoditisation. Leverage standard infrastructure for operational efficiency.
Pattern Recognition
Component evolution inevitability: All components naturally evolve toward commodity over time through competition, standardisation, and technology advancement. Organisations can't prevent evolution but can leverage it strategically.
Value chain interdependencies: Component evolution affects connected components throughout value chain. Commodity infrastructure enables Genesis-stage application innovation. Product-stage components often depend on commodity infrastructure for cost-effectiveness.
Competitive advantage migration: As components commoditise, competitive advantage migrates to newer Genesis and custom-built components. Organisations must continuously develop new innovations while allowing mature components to commoditise.
Ecosystem positioning: Strategic advantage often comes from ecosystem positioning rather than individual component ownership. Control key Genesis components while leveraging commodity components from efficient providers.
Integration and Maintenance
Investment allocation: Invest innovation resources in Genesis and custom-built components while cost-optimising product and commodity components. Different evolutionary stages require different management approaches and success metrics.
Partnership strategy: Partner for commodity components, build competitive advantage in Genesis components, optimise products through best practices, create custom solutions for strategic differentiation.
Timing considerations: Anticipate component evolution to time strategic moves appropriately. Early investment in Genesis components creates an advantage while premature commoditisation investment wastes resources on differentiation that markets won't value.
Portfolio balance: Maintain a balanced portfolio across evolutionary stages. Pure Genesis strategy creates high risk while pure commodity strategy eliminates competitive advantage. Strategic balance provides stability with growth potential.
Before > After
Before state: Validated strategies operating in isolation without understanding system dynamics, feedback loops, constraint relationships, or competitive evolution patterns that determine sustainable advantage.
After state: Systems-integrated strategic thinking that accounts for causal relationships (dynamic feedback understanding), constraint leverage (bottleneck-focused improvement), competitive positioning (evolutionary landscape awareness), sustainable advantage creation through systems perspective.
The compound effect: These three exercises provide comprehensive systems understanding across dynamics, constraints, and evolution. Causal loops reveal system behaviour patterns. Constraint maps identify leverage points. Wardley maps position strategy within evolving competitive landscapes.
Measurable Indicators
Dynamic understanding: Ability to predict systemic responses to strategic interventions rather than just immediate effects (target: 80% accuracy in predicting secondary effects of strategic changes).
Constraint focus: Resource allocation concentrated on true bottlenecks rather than distributed across all improvement opportunities (target: 70%+ improvement resources focused on identified constraints).
Evolutionary positioning: Strategic investments aligned with component evolutionary stage rather than treating all elements equally (target: Genesis/custom investment 60%+, commodity optimisation 40%-).
Common Failure Modes
Linear thinking persistence: Using systems tools but maintaining linear cause-effect assumptions without recognising feedback loops and systemic relationships. Prevention: Explicitly map and discuss feedback loops in all strategic analysis.
Constraint distribution: Spreading improvement efforts across multiple areas rather than focusing on true system bottlenecks. Prevention: Validate constraint identification through performance correlation analysis before resource allocation.
Evolution resistance: Fighting component commoditisation rather than leveraging evolutionary forces for strategic advantage. Prevention: Assess component evolution objectively based on market forces rather than organisational preferences.
Your Week 7 Implementation Challenge
Apply this systems perspective sequence to the assumption-validated strategy you've developed through Weeks 2-6. Use your Week 2 domain diagnosis to calibrate systems complexity—Complex domains need more comprehensive systems analysis than Simple domains.
Execution Protocol
Session structure: 210 minutes total
- Causal Loop Diagrams: 90 minutes (30 variable identification, 35 relationship mapping, 25 loop analysis and strategic insight development)
- Constraint Maps: 75 minutes (25 constraint discovery, 20 classification and impact assessment, 15 visual mapping, 15 leverage strategy development)
- Wardley Maps: 45 minutes (15 component identification, 15 evolutionary assessment, 15 strategic positioning analysis)
Success Criteria Checklist
Causal Loop Diagram completion:
[ ] Identified 8-15 key variables affecting strategic system performance
[ ] Mapped causal relationships with clear polarity indicators and delay markings
[ ] Identified 3-5 feedback loops including both reinforcing and balancing patterns
[ ] Analysed system dynamics to identify leverage points for strategic intervention
[ ] Developed intervention strategies that work with system dynamics rather than against them
Constraint Map development:
[ ] Discovered constraints across resource, process, market, and organisational categories
[ ] Classified constraints by type, change difficulty, performance impact, and time horizon
[ ] Created visual map plotting constraints by change cost and performance impact
[ ] Identified high-leverage constraint modifications providing maximum strategic benefit
[ ] Developed constraint resolution sequence and resource allocation priorities
Wardley Map strategic positioning:
[ ] Identified business components across value chain from infrastructure to user-facing elements
[ ] Classified components by evolutionary stage using Genesis/Custom/Product/Commodity framework
[ ] Positioned components on visibility/evolution map with accurate strategic landscape representation
[ ] Analysed evolutionary pressures and competitive positioning opportunities
[ ] Developed investment and partnership strategies aligned with component evolutionary stage
Diagnostic Signals and Responses
Positive indicators:
- Systems insight emergence: Analysis reveals non-obvious relationships and leverage points that weren't apparent through linear thinking approaches.
- Strategic reframing: Systems perspective changes resource allocation priorities and strategic focus based on constraint and evolution insights.
- Integration coherence: All three exercises point toward consistent strategic implications rather than contradictory recommendations.
Warning signals:
- Complexity overwhelm: If systems analysis produces too many variables and relationships to be actionable, simplify focus to most strategically relevant elements.
- Analysis paralysis: If systems thinking prevents decision-making progress, use systems insights to inform rather than replace strategic judgment.
- Tool isolation: If exercises feel disconnected from actual strategic decisions, strengthen integration with previous week's assumption validation and evaluation work.
Domain-Specific Systems Calibration
Simple domain approach: Focus on straightforward cause-effect relationships and obvious constraints. Use basic Wardley mapping for competitive positioning without complex evolution analysis.
Complicated domain approach: Emphasis on expert input for systems analysis and technical constraint identification. Moderate Wardley mapping complexity for technical component evolution.
Complex domain approach: Comprehensive systems analysis across all exercises. Extensive feedback loop identification and constraint interaction analysis. Full Wardley mapping with evolution prediction and positioning strategy.
Chaotic domain approach: Focus on system stabilisation rather than optimisation. Rapid constraint identification for crisis management. Simplified Wardley mapping for immediate competitive positioning.
The Bridge
Systems perspective achieved. Strategic thinking now integrates dynamic relationships, constraint leverage, and competitive evolution within interconnected business environments. Validated assumptions operate through understood system dynamics with a positioned competitive advantage. Now you need an external challenge perspective to stress-test systems-integrated strategy against adversarial thinking and environmental forces beyond organisational control.
The logic of progression: Week 1 taught rapid decision-making. Week 2 taught precision framing. Week 3 taught option generation. Week 4 taught evaluation. Week 5 taught risk anticipation. Week 6 taught assumption validation. Week 7 taught systems integration. Week 8 will teach external challenge—the perspective determining whether systems-integrated strategies survive contact with competitive reality and environmental uncertainty.
The internal-to-external bridge: Systems thinking provides an internal integration perspective, but the external challenge perspective determines whether integrated strategies withstand adversarial analysis, competitive responses, and environmental forces that operate outside organisational control or influence.
Next focus: From systems integration to external challenge—three exercises that stress-test systems-integrated strategies against adversarial thinking (Red Teaming), environmental forces (Outside-In Thinking), and scenario stress-testing (Backwards What-If) that determine strategic survival in competitive reality.
Because you can integrate every system perfectly and fail strategically if your strategy doesn't account for adversarial intelligence, competitive responses, and environmental forces that operate according to their logic rather than your strategic preferences.
Ready to master systematic strategic thinking? Get the complete PRISM Strategic Tabletop Exercise Guide with all 27 exercises, facilitation guides, and advanced techniques. Transform your team's decision-making in real-time, in real rooms, on real challenges.
Get the full stack PRISM Tabletop Exercise set here for AUD 40, and unlock all 27 exercises.
